Choosing the right Bench Instruments is rarely about selecting the most expensive model. It is about matching accuracy, bandwidth, safety, workflow, and future demand.
MarketsandMarkets’ 2024 Test and Measurement Equipment Market report identifies automation, connected laboratories, and higher measurement precision as major market drivers. These trends affect universities, electronics workshops, production lines, and calibration facilities. A compact oscilloscope may look suitable on a crowded workbench. However, limited memory depth can hide short signal disturbances. A multimeter with impressive resolution may still produce unreliable readings without proper input protection and calibration.
Details matter. Small errors multiply.
NIST Handbook 143 emphasizes documented calibration procedures and traceability for dependable measurement results. ISO/IEC 17025:2017 also highlights technical competence, equipment control, and measurement validity. These principles provide a practical foundation for evaluating Bench Instruments beyond product brochures. Consider accuracy specifications, uncertainty, resolution, sample rate, interface options, environmental limits, service support, and total ownership cost. The cheapest instrument can become expensive when downtime, replacement probes, and recalibration are included.
No checklist can replace engineering judgment. Specifications may appear comparable, yet manufacturers sometimes define them under different conditions. That is where careful questioning becomes essential. Review independent test reports, confirm warranty terms, inspect software compatibility, and ask whether the instrument fits real measurements. A crowded bench, unstable power source, or poorly shielded cable can change results. The following ten tips offer a structured starting point, while leaving room for professional review and honest reconsideration.
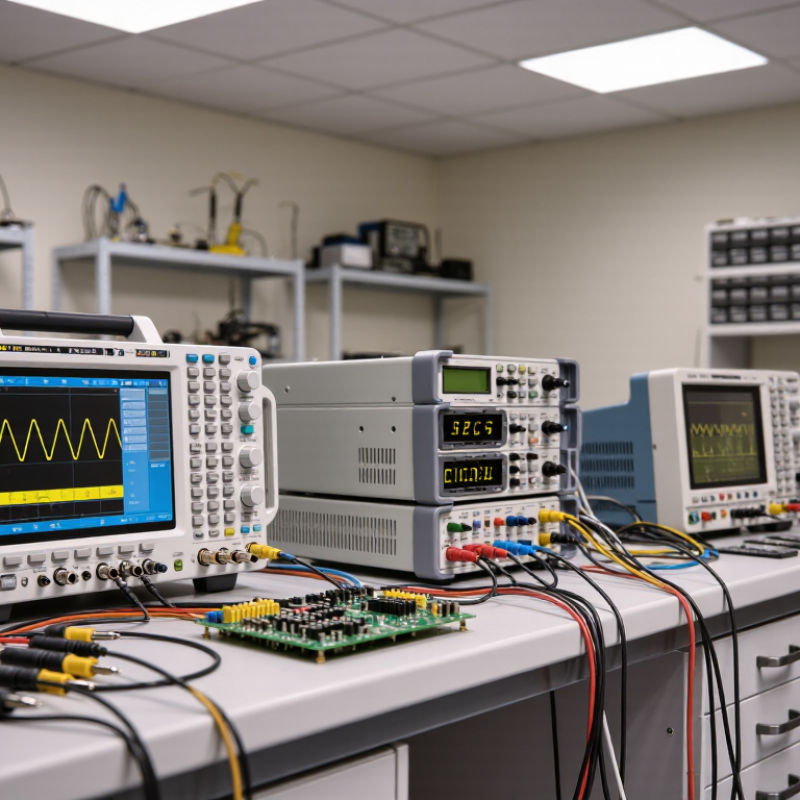
Before comparing bench instruments, write down the real measurement task. Include the expected range, signal type, operating temperature, and required speed. A 0–10 V sensor needs different protection and resolution than a low-level resistance measurement. Do not choose a wide range automatically. Excessive range can reduce useful resolution.
Tip 1: Define the normal value, the maximum value, and the worst-case value separately.
Accuracy is not the same as resolution. An instrument may display six digits while producing unreliable results under changing temperature. Set a practical limit: total measurement uncertainty should remain at or below 25% of the permitted error or tolerance. Include instrument accuracy, calibration drift, repeatability, lead effects, and environmental influences.
Tip 2: Build a simple uncertainty budget before purchasing. It may reveal that the display is not the main problem.
In laboratory work, I check performance with a known reference and repeat measurements after warm-up. I once selected an instrument with excellent stated accuracy, but its input range was poorly matched to the test signal. The readings looked impressive, yet small changes were difficult to trust. That choice needed more reflection.
Tip 3: Test the instrument near the values you actually measure, not only at its best specification.
Keep records of temperature, setup, readings, and operator changes. Small details matter.
10 Tips for Choosing the Right Bench Instruments
Match Resolution to Tolerance with a 10:1 Display Margin
A bench instrument should reveal meaningful change, not merely produce extra digits. The AIAG Measurement Systems Analysis guidance commonly applies a 10:1 discrimination target. For a 0.10 V total tolerance, select a display resolution of 0.01 V or finer. That margin makes acceptance decisions easier to defend.
Use the tolerance width, not marketing digits. A meter showing 0.001 V may still lack accuracy, stability, or suitable uncertainty. NIST Technical Note 1297 explains that measurement uncertainty must be evaluated with the reported result. Therefore, check resolution, accuracy, repeatability, and calibration conditions together. A crowded display is not proof of quality.
Consider the workbench itself. Thermal drift, cable resistance, grounding, and operator technique can consume the margin quickly. The NIST/SEMATECH e-Handbook of Statistical Methods warns that coarse measurement resolution can hide process variation. In practice, record several readings after warm-up, then compare their spread with the tolerance. The 10:1 rule is useful, but it is not sacred. Extremely fine resolution can increase cost without improving decisions. I sometimes treat it as a starting point, then question it. That reflection matters when the specification is tight, the environment is unstable, or the instrument’s uncertainty statement is incomplete.
A practical bench instrument should display increments no larger than one-tenth of the total allowed tolerance band. The chart normalizes each measurement to show the tolerance band as 100% and the recommended display increment as 10%.
| Measurement | Nominal Value | Allowed Tolerance | Tolerance Band | Recommended Display Increment |
|---|---|---|---|---|
| DC Voltage | 5 V | ±50 mV | 100 mV | 10 mV or finer |
| Temperature | 100 °C | ±1 °C | 2 °C | 0.2 °C or finer |
| Pressure | 100 kPa | ±0.5 kPa | 1 kPa | 0.1 kPa or finer |
| DC Current | 2 A | ±10 mA | 20 mA | 2 mA or finer |
| Frequency | 1 MHz | ±100 Hz | 200 Hz | 20 Hz or finer |
The 10:1 margin improves readability and helps reveal drift or small changes before they approach the measurement limit. Confirm the instrument’s accuracy, stability, noise, and calibration specifications in addition to its displayed resolution.
When choosing a bench instrument, verify both bandwidth and sampling rate before trusting its display. The sampling rate should be at least twice the highest signal frequency, following the Nyquist limit. In practice, that minimum is rarely comfortable. I usually choose a much higher rate to capture waveform edges, overshoot, and timing details. A 100 MHz signal may contain harmonics far above 100 MHz, especially when its edges look sharp.
Bandwidth and sampling rate are different specifications. Bandwidth describes how much analog frequency content the input path can pass. Sampling rate describes how often the instrument records that signal. A high sampling rate cannot repair insufficient analog bandwidth. Likewise, wide bandwidth cannot prevent aliasing when the sampling rate is too low. Check the instrument’s bandwidth at the probe tip, not only in the main unit. Probe loading can soften a fast edge and create a misleadingly clean trace.
For repetitive signals, examine the sample depth and time scale as well. A fast rate with limited memory may show only a small portion of the event. I once focused on the headline sample rate and missed this limitation. That mistake changed my measurement confidence. Use anti-alias filtering when available, and leave margin above the theoretical two-times requirement. Real circuits are untidy. Their noise, harmonics, and transient spikes deserve room.
10 Tips for Choosing the Right Bench Instruments
Assess Loading with ≥10 MΩ Input Impedance for Voltage Tests
A voltage instrument should observe the circuit, not reshape it. For high-resistance nodes, choose an input impedance of at least 10 MΩ. A 100 kΩ source sees only about 0.99% attenuation. With a 1 MΩ source, the same instrument causes nearly 9.1% error. That difference can hide a weak sensor signal or distort a bias measurement. NIST Technical Note 1297 recommends reporting measurement uncertainty with a coverage factor, commonly k=2 for about 95% confidence. Loading belongs in that uncertainty budget.
Tip 1: Estimate the source resistance before selecting the meter. Measure at the test point, then calculate the divider formed by the source and input impedance. Tip 2: Check the specification at the actual voltage range. Some instruments change impedance across modes. Tip 3: Prefer a buffered input for delicate circuits. It may reduce disturbance, but it can add offset and noise.
Practical testing still matters. Connect a 10 MΩ instrument, record the voltage, then repeat with a higher-impedance input if available. A visible change is evidence of loading, not merely a poor reading. IEC 61010 guidance also emphasizes measurement-category and transient safety, so impedance alone is insufficient. I once treated a stable display as trustworthy. That was too optimistic. NIST SP 811 also stresses traceable units and stated uncertainty, yet many bench notes omit cable effects. Include them. Keep leads short, avoid touching the node, and document temperature, range, and probe configuration. Small details often decide whether a voltage result is useful.
| Tip | Instrument Category | Typical Input Impedance | Best Use Case | Loading Risk in Voltage Tests | Selection Guidance |
|---|---|---|---|---|---|
| 1 | Bench digital multimeter | Typically 10 MΩ; higher ranges may be available | General DC and low-frequency AC voltage measurements | Low for sources below approximately 100 kΩ | Choose an input impedance of at least 10 MΩ for ordinary high-impedance voltage measurements. |
| 2 | High-impedance digital multimeter | Typically 10 MΩ to 100 MΩ | Weak, filtered, sensor, and bias-reference circuits | Very low when the circuit source resistance is relatively high | Prefer this category when the measured node cannot supply significant current without changing its voltage. |
| 3 | Oscilloscope with a 10 MΩ probe setting | Approximately 10 MΩ in parallel with probe capacitance | Waveform, transient, noise, and timing analysis | Frequency-dependent because probe capacitance can load fast signals | Use a 10 MΩ probe for general voltage work; account for capacitance on high-speed or high-impedance nodes. |
| 4 | Oscilloscope with a 1 MΩ input setting | Approximately 1 MΩ in parallel with input capacitance | Low-impedance sources and standard laboratory signals | Moderate to high for source resistances above approximately 10 kΩ | Avoid this setting for high-impedance nodes unless the circuit is specifically designed for the load. |
| 5 | Electrometer or picoammeter voltage input | Often 1 GΩ or higher | Electrochemical, insulation, photodiode, and leakage-current measurements | Minimal resistive loading, but leakage and noise become important | Use when the source resistance is in the megohm-to-gigohm range and input bias current must be extremely low. |
| 6 | Data-acquisition voltage input | Commonly 1 MΩ to 10 MΩ, depending on input design | Multichannel logging and automated test systems | Can be significant for sensor outputs and resistor-divider networks | Verify the input impedance for every channel and consider a buffer amplifier for high-resistance sources. |
| 7 | Instrumentation amplifier input | Typically 100 MΩ to 10 GΩ at the amplifier input | Bridge sensors, thermocouples, biomedical signals, and differential measurements | Very low when correctly configured | Check input bias current, common-mode range, and protection components in addition to nominal impedance. |
| 8 | Power analyzer voltage input | Often approximately 1 MΩ to 10 MΩ | Power, energy, harmonics, and power-factor measurements | Application-dependent, especially in voltage-divider and control circuits | Confirm that the analyzer input does not materially alter the circuit under test or the divider ratio. |
| 9 | Buffered active probe | Typically 1 MΩ or higher, with very low input capacitance | Fast, high-impedance, or sensitive analog and digital nodes | Low capacitive loading compared with many passive probes | Select an active probe when bandwidth, rise time, or signal integrity is more important than simple DC loading. |
| 10 | High-voltage differential probe | Often several megohms per input lead; exact value depends on the probe design | Floating or high-voltage measurements with an oscilloscope | Depends on the resistor network and common-mode rating | Check differential input impedance, common-mode voltage, bandwidth, attenuation accuracy, and safety category before use. |
10 Tips for Choosing the Right Bench Instruments
Tip 1: Check IEC 61010-1 safety requirements before comparing accuracy or features. This standard addresses electrical, mechanical, thermal, and fire-related risks in measurement equipment. Look for clear markings, protective terminals, suitable insulation, and accessible safety documentation. A crowded workbench can hide hazards. I once overlooked cable routing, and the setup became unsafe during routine testing.
Tip 2: Treat calibration as operational evidence, not paperwork. Confirm the calibration date, measurement uncertainty, tested ranges, and adjustment conditions. A certificate without these details may provide limited confidence. Ask whether the laboratory follows ISO/IEC 17025 and whether results are traceable to recognized national or international standards. Traceability should connect the instrument’s readings to documented reference standards through an unbroken chain.
Tip 3: Match the calibration interval to actual use. Instruments exposed to vibration, heat, frequent transport, or daily production work may drift faster. Record verification checks between formal calibrations. A simple reference test can reveal developing problems early. Do not assume factory specifications reflect your environment; they often describe ideal conditions.
Tip 4: Review the complete measurement path. Check probes, leads, adapters, software, and grounding arrangements. Each part can affect uncertainty and safety. Keep calibration records with asset numbers and environmental notes. Digital records help, but only when technicians update them consistently. My own process still needs improvement, especially after urgent repairs. That weakness is worth acknowledging, because reliable measurements depend on disciplined habits as much as capable instruments.
Use the tolerance width, not the number of displayed digits. For a 0.10 V tolerance, choose 0.01 V resolution or finer. This supports clearer acceptance decisions.
No. Extra digits may hide poor accuracy, drift, or unstable readings. A crowded display is not proof of quality. Check the full uncertainty picture.
Review accuracy, repeatability, stability, uncertainty, and calibration conditions. These factors work together. One impressive specification cannot replace them.
Heat, cable resistance, grounding, and operator technique can reduce the available margin. Let the instrument warm up before recording readings. Then compare several results.
It is a useful starting point, not an absolute rule. Very fine resolution can increase cost without improving decisions. I sometimes follow it too mechanically.
Check protective terminals, insulation, markings, and accessible safety information. Inspect cable routing around the bench. Small setup mistakes can create real hazards.
Look for the calibration date, tested ranges, uncertainty, and adjustment conditions. Traceability should connect readings to documented reference standards. A certificate with missing details offers limited confidence.
Match the interval to actual use, transport, vibration, heat, and production demands. Use simple reference checks between formal calibrations. Factory conditions may not match your workspace.
Include probes, leads, adapters, software, grounding, and environmental conditions. Each part can affect safety and uncertainty. Records help, but only when technicians update them consistently.
Choosing the right Bench Instruments begins with clearly defining your measurement needs. Identify the expected signal range, required accuracy, and acceptable uncertainty, aiming to keep uncertainty at or below 25% of the measurement requirement. Resolution should also match the tolerance of the device under test, with a practical 10:1 display margin to make small differences easy to detect. These criteria help ensure that readings are meaningful rather than merely precise-looking.
Next, confirm that the instrument’s bandwidth and sampling rate are suitable for the highest signal frequency, using at least twice that frequency as a basic sampling reference. For voltage measurements, an input impedance of 10 MΩ or higher can reduce loading effects and preserve circuit behavior. Finally, review IEC 61010-1 safety compliance, calibration options, and ISO/IEC 17025 traceability. Considering all of these factors together supports reliable, safe, and repeatable testing in laboratory and development environments.

Machine-Win